









Features
Everything PerspecTask can do, one page per feature.
Multiple parents
Put one task under several goals at once and break any goal into subtasks as deep as you like. Its progress and time count toward every goal it belongs to.
Learn more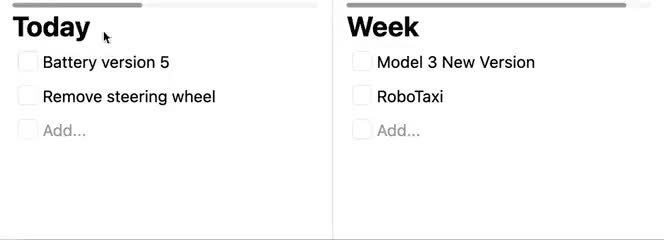
Timer
Start a timer on the task you are working on and see it in your browser tab. Its time adds up into every goal above it, so you see the time a whole goal took.
Learn more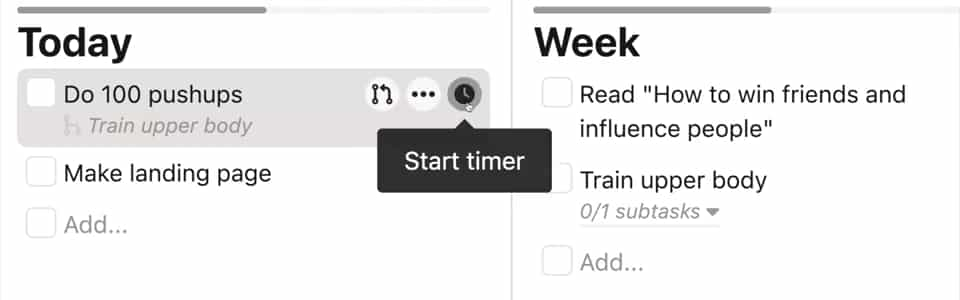
Work Cycles
Your timer sessions drawn on a day-by-hour grid for the last week, month or year, with the share of each hour you usually work.
Learn more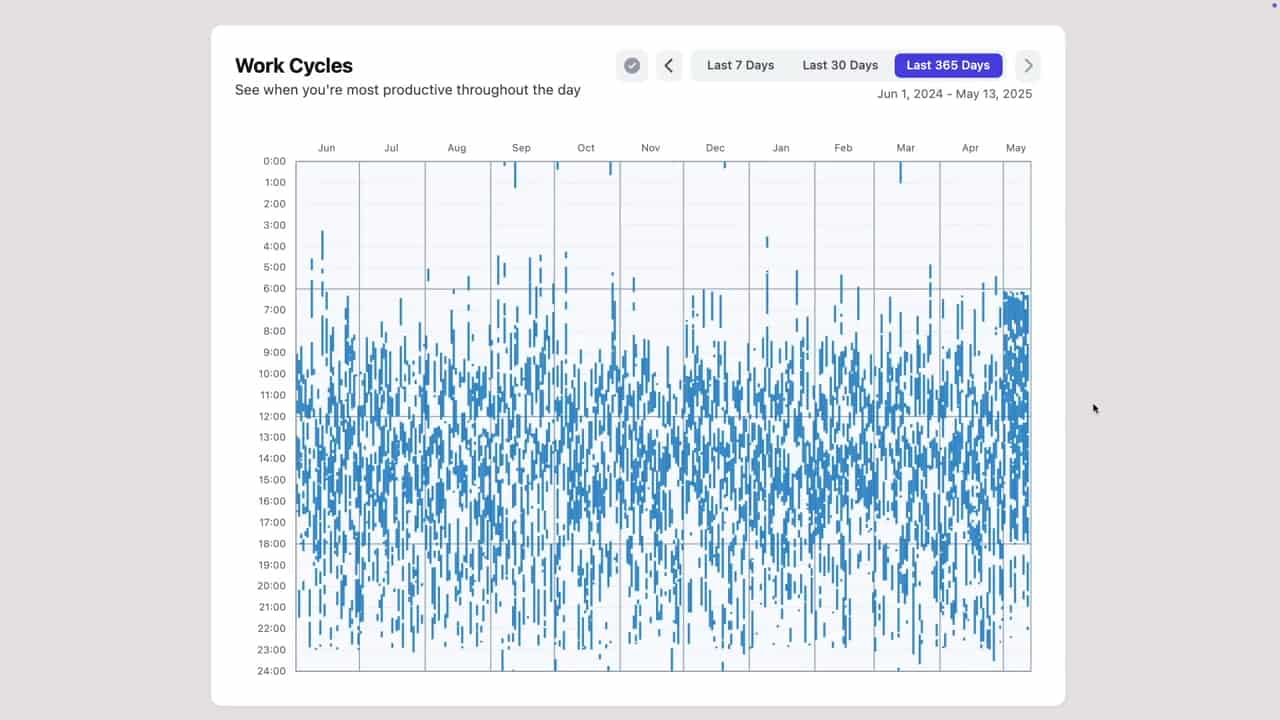
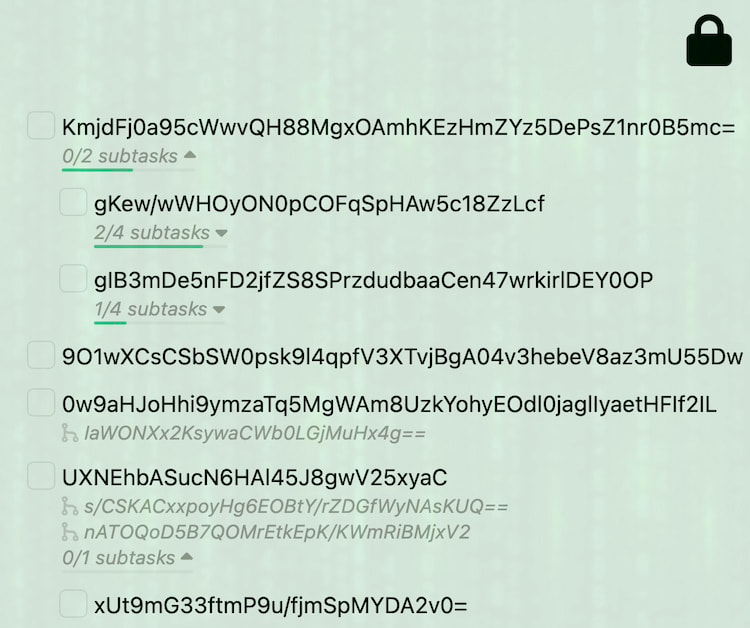
End-to-end encryption
Encrypt a task and its title and description are locked on your device with a key made from your password. We never see the key, and our servers only store the scrambled text.
Learn more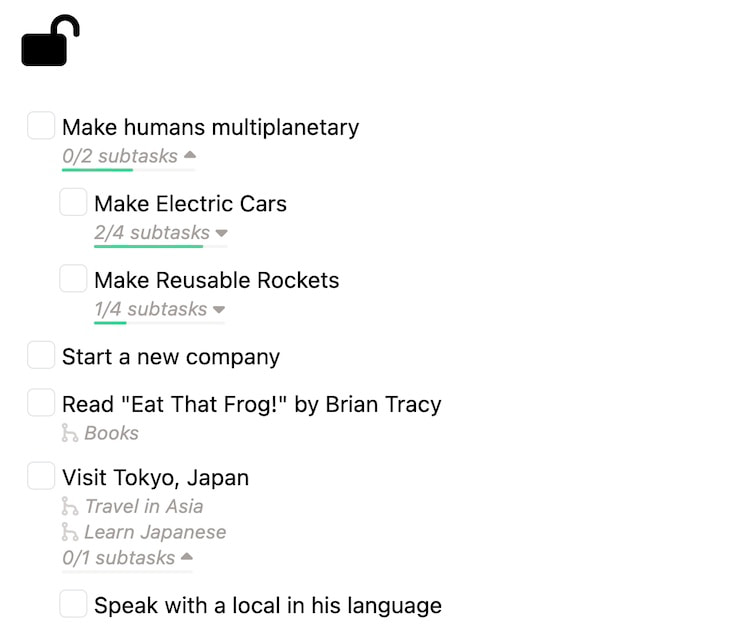
Streaks
Count the days in a row you finished at least one task, see a year of finished tasks as a grid of squares, and keep it all on one Reflect page.
Learn more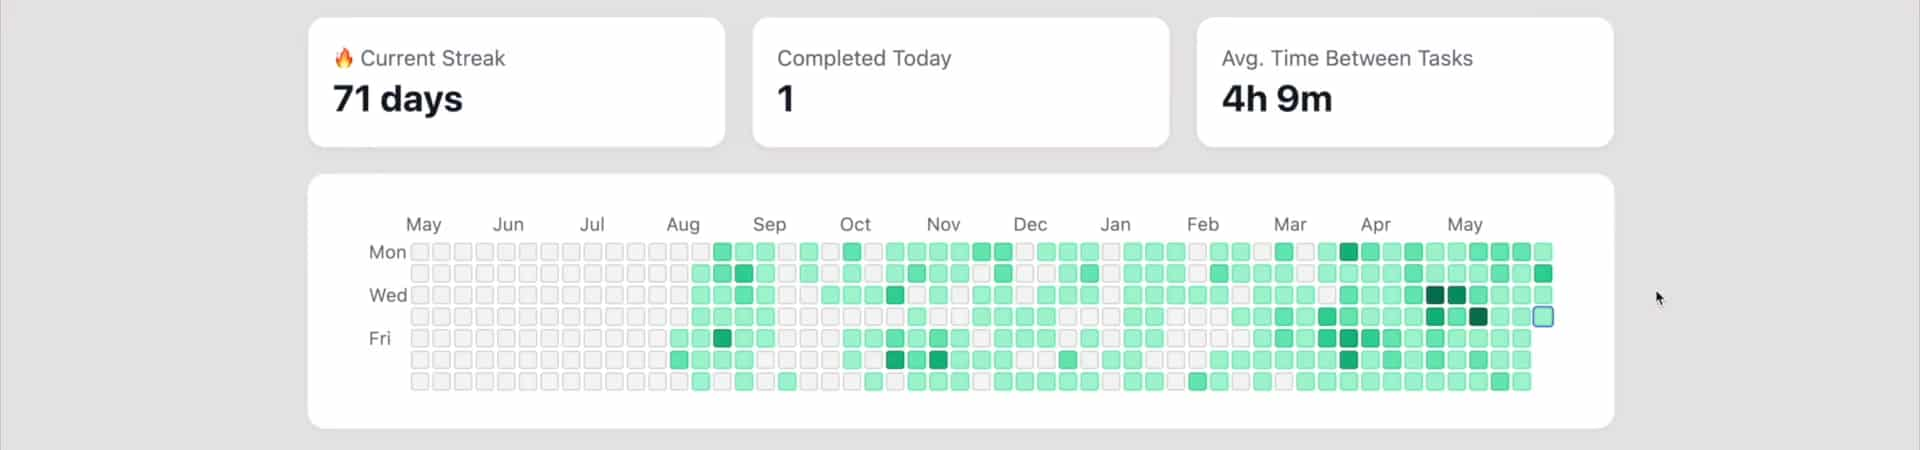
Graph View
See a goal and every subtask under it as a radial tree, one ring per level, colored by what is done, open or cancelled.
Learn more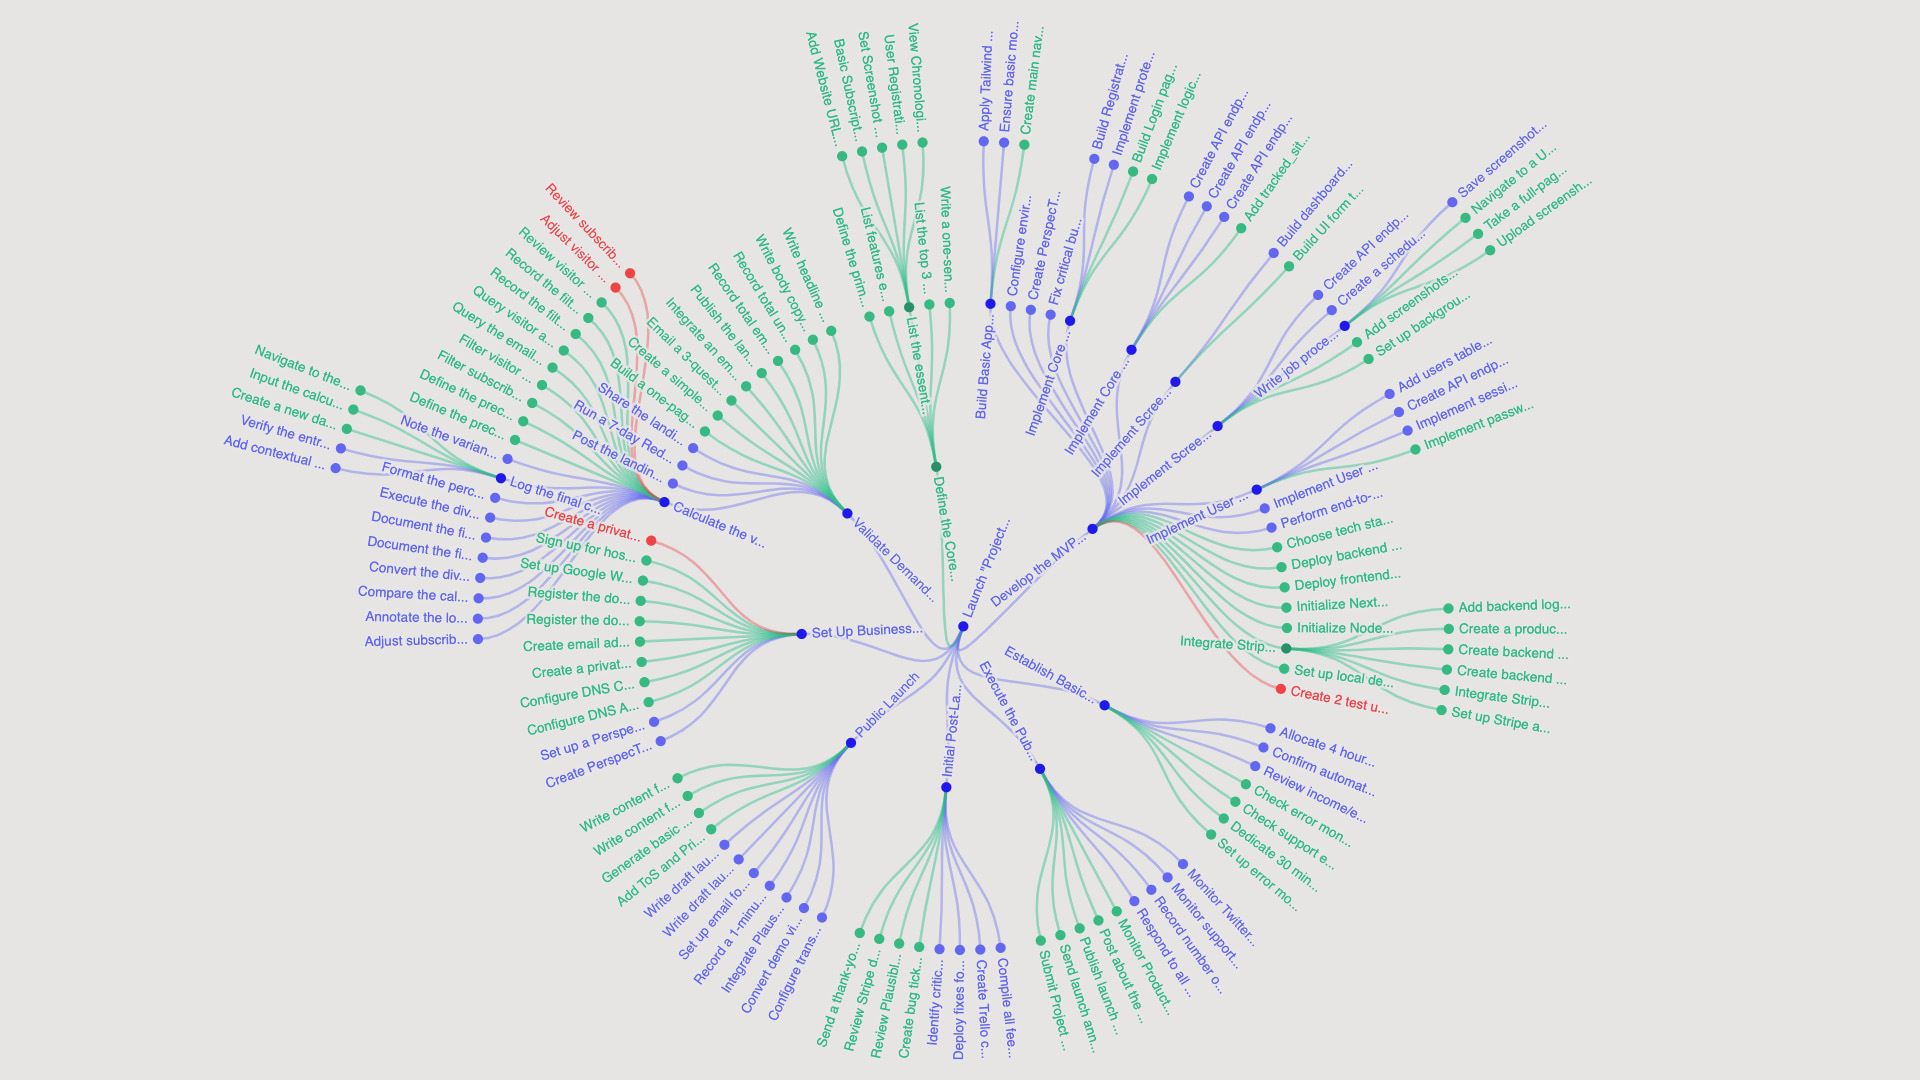
Life planner
Schedule each task into a day, week, month, quarter, year or Life, drag it between periods, and see how much of each period has passed and how much is done.
Learn moreW44, 2026
26 Oct-1 Nov
Long run: 16 km
Run a half marathon
Unit 7 lessons
Finish Spanish A2
2/3 subtasks ▾Pay the car insurance
Call grandma
Task Perspective
Open a task or a period in columns: its subtasks first, then each deeper level in the next column to the right. Pick a task to highlight it and every parent above it.
Learn moreSide projects
Launch the podcast
Record the first 3 episodes
1/3 subtasksDesign the cover art
0/2 subtasksSet up hosting and RSS
Write a show notes template
Record the first 3
Episode 1: Why we started
Episode 2: Guest interview
1/4 subtasksEpisode 3: Listener Q&A
Design the cover a
Pick fonts and colors
Draft three versions
Episode 2: Guest i
Book the guest
Write the questions
Record the call
Edit the audio
Kanban board
Put a goal's subtasks, a week's tasks or any mix of them on one board with a column per status. Drag a card to another column to change its status.
Learn moreSide projects
Launch the podcast
Inbox
2
Design the cover art
Pick a hosting service
- Add...
In Progress
1
Record episode 1
- Add...
Waiting
1
Book the first guest
- Add...
Completed
1
Buy a microphone
Gantt chart
Each task with a deadline is a bar across the day, week, month or year it is scheduled in, with arrows from the tasks that block it. Drag a bar to change its dates.
Learn moreBullets
Type a plan with Enter and Tab, zoom into any bullet, outline everything due this week, and open two outlines side by side. Each bullet is a real task.
Learn moreLaunch the newsletter
Short, one link, sent the day they sign up
Canvas
Put your tasks on an infinite board, drag them where you want and draw arrows to show how they connect. Tidy up lays the board out for you.
Learn moreTreemap and Flow
The Treemap draws a goal as boxes inside boxes, sized by how many tasks they hold. Flow traces one task through its parents to the goals it serves.
Learn moreKPIs and Dashboard
Log a target and actual numbers on any task, then follow them on a Dashboard of widgets you drag and resize: KPI graph, Goals radar, Urgent tasks and more.
Learn moreOverdue1
Send the October newsletter
Due soon2
Log this week’s long run
Pack the print orders
12 days
Milestones and Timeline
Milestones puts the KPI targets and readings of all your tasks on one vertical line, the future above Today. Timeline groups your tasks by the month you created them.
Learn moreTask history
Each task keeps its title and description edits as red and green diffs, plus status, deadline and parent changes. Cancel a task instead of deleting it and write why.
Learn moreRun a marathon in October
Cancelled: my knee needs a season of rest. Try again next spring.
Follow the 16-week plan, 4 runs a week.
Percentile Feedback
A line for every day you tracked time, showing the share of the day worked so far. Today gets a percentile against your past days at the same hour, and where it ends if you stop or keep going.
Learn morePercentile Feedback
55.6%, 100th
13:19:59
18.1%, 50th
7 out of 13 days
30.2%
04:20:00
75th
percentile
Daily Performance Comparison (4 out of 13 days)
Task Burn Rate
Task Burn Rate adds up the tasks you complete through the day, week, month, quarter or year, next to the last one, your best and your average. Task Activity charts created against completed.
Learn moreTask Burn Rate
Completed tasks comparison
Task Activity
Showing cumulative task creation, completion, and cancellation by day
GitHub integration
Pull requests show up on the tasks they belong to, with their state, CI checks, review and preview deploy, updated live. Link one by putting the task code in its branch or title.
Learn moreAdd dark mode to the app

Created the task “Add dark mode” in PerspecTask and started on it.
Finished. I moved it to Waiting so you can review it.
Opened pull request #42.
The preview build is on its way.
Checked the preview, looks good. Merge it.
Merged #42. The task is done.
 app.perspectask.com/kanban
In Progress
Weekly digest email
Export invoices as CSV
Waiting
Pricing page copy
Completed
Add dark mode
Stripe webhooks