











See when you actually work
Work Cycles turns your timers into a map of your days: one column per day, the hours of the day from top to bottom, and a block for every session. One look shows the hours you work best and the days you never got started.
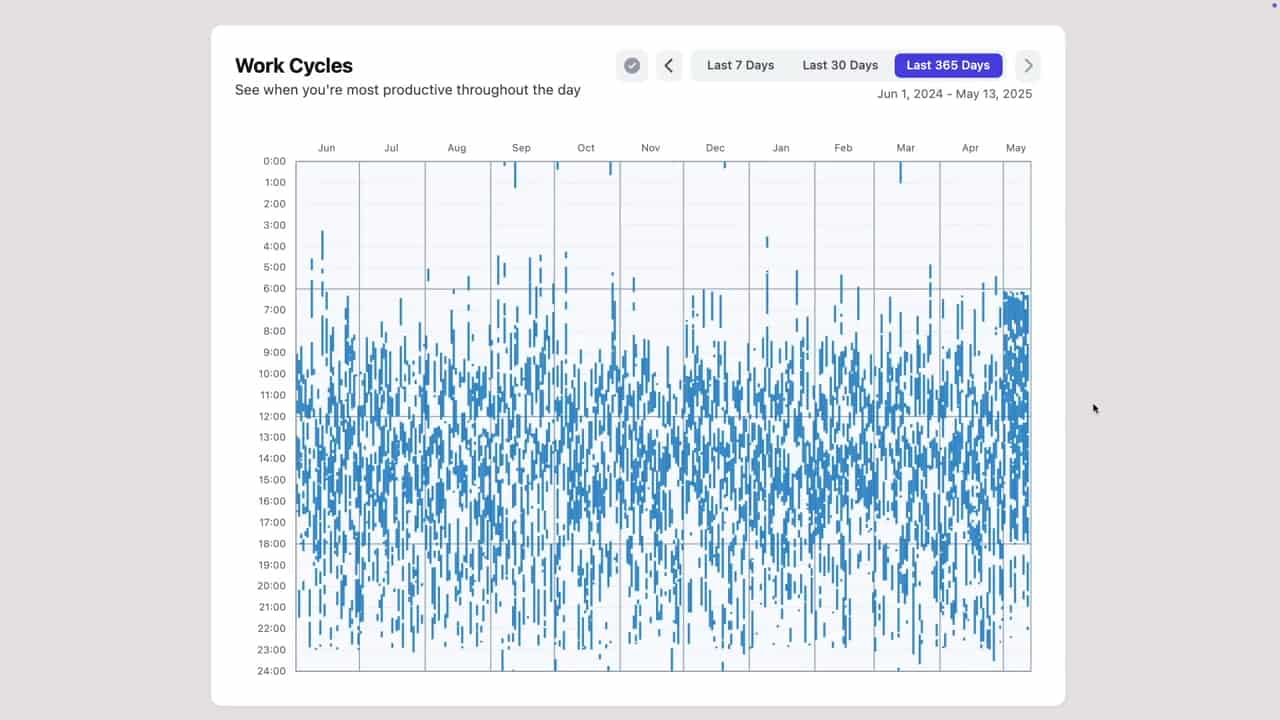
Your timers on a day-by-hour grid
Each timer session is a blue block from its start to its end, and a running one pulses. Green dots mark when you finished tasks. Under the grid, the 7- and 30-day views total how long you worked each day.
Look at the last 7, 30 or 365 days, and page back through older ones. PerspecTask remembers the range you picked.
- One column per day, one block per session
- Green dots where you finished tasks
- Last 7, 30 or 365 days
- Hover a block for the task and its duration
Your best hours, as a number
Beside each hour, an average shows how much of that hour you worked on a typical day in the range, shaded from light to dark. Hover it to see the exact time tracked in that hour. The dark rows are your work hours; the light ones are where your day leaks.
Fix a session right on the chart
Forgot to stop a timer? Click its block to change the start or end time, or delete it. Right-click a block to open its task.
Today against your other days
On the same Reflect page, Percentile Feedback plots how much of today you have worked so far against every earlier day at the same hour, and tells you your percentile. Two dashed lines show where you end up if you stop now or keep working until the end of the day.
How to see your work cycles
Time your tasks
Start the timer on the task you are working on. Every session longer than a few seconds lands on the chart.
Open Reflect
Click Reflect in the sidebar and scroll to Work Cycles. You can also add it to your dashboard as a widget.
Pick a range
Choose the last 7, 30 or 365 days and read the pattern: when you start, when you stop and which hours stay empty.
Frequently asked questions
- Where do I find Work Cycles?
- On the Reflect page (Reflect in the sidebar), and as a Work cycles widget you can add to your dashboard.
- Where does the data come from?
- From your task timers. Every session longer than a few seconds is one block on the chart, including sessions of tasks you have since deleted.
- What does the percentage next to each hour mean?
- It is the share of that hour you worked on an average day in the range you picked. 50% at 10:00 means you worked about 30 minutes of the 10 o’clock hour on a typical day.
- Can I correct a session?
- Yes. Click a block to change its start or end time, or to delete it. Sessions cannot overlap and cannot end in the future.
- What is Percentile Feedback?
- A chart on the Reflect page that compares how much of today you have worked so far with every earlier day at the same time of day, and shows your percentile and where the day ends if you stop now or keep going.
Plan your day around the hours you work best
Time your tasks for a week and Work Cycles shows you when your real work happens.