









See a whole goal in one graph
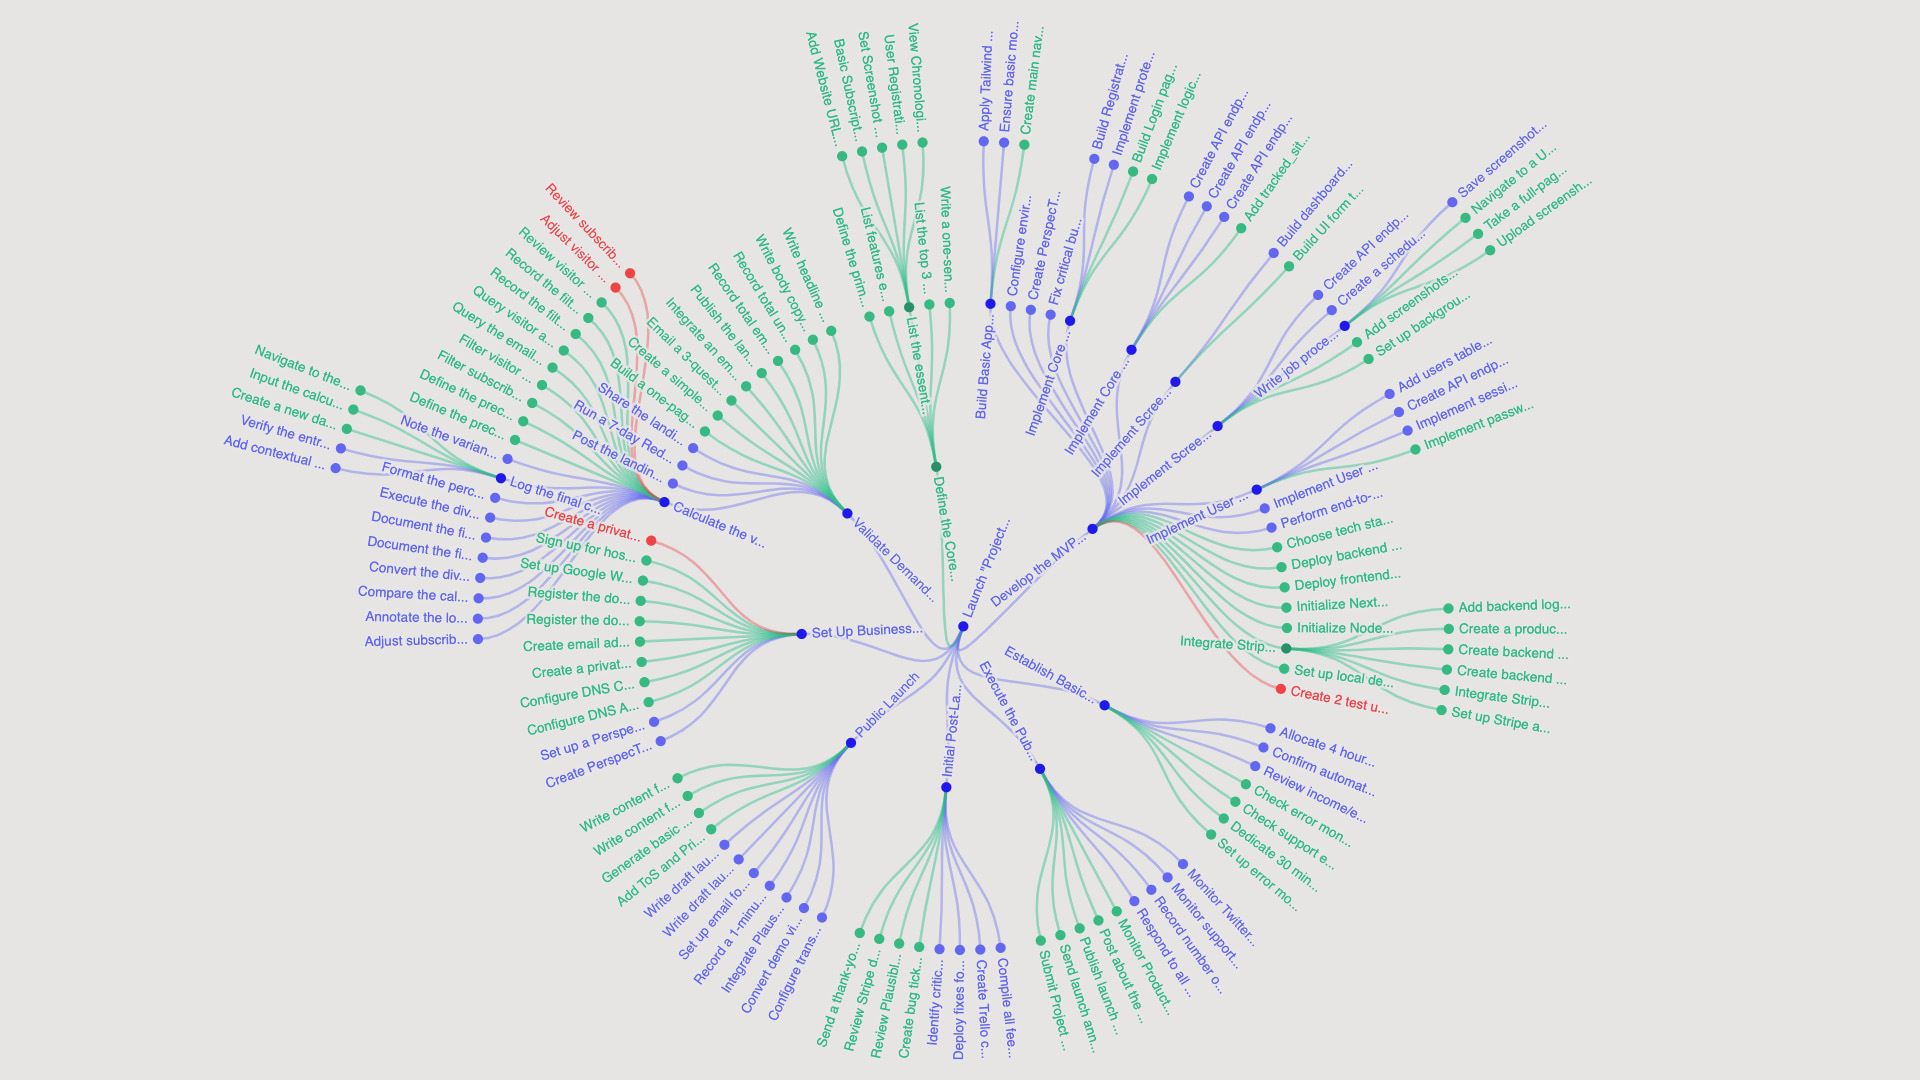
Graph View draws a task and all its subtasks as a radial tree: the goal in the middle and each level of subtasks in a ring around it. Green is done, red is cancelled, indigo is still open. You see how big a goal is and how far along it is in one look.
See the forest and the trees
Every ring is one level of subtasks, so you see how deep a goal goes and how wide each level is. A stats line counts the levels and the tasks on each one.
A task with several parents is drawn under each of them, so you can spot the tasks that many parts of your plan depend on.
- Green: completed
- Indigo: still open
- Red: cancelled
- Click a task to open it
Move around the tree
Zoom with the wheel or a pinch, drag to pan, rotate in 15° steps, fit the graph to the screen or go fullscreen. Hover a task and click its button to make it the new center. Sliders set the tree radius, the node size and the spacing, and labels can be turned off for a cleaner picture.
Other ways to look at your plan
Graph View is one of several views of the same tasks. The Treemap draws subtasks as nested rectangles, the Flow view traces every path from a task through its parents, and Gantt, Timeline, Milestones, Kanban, Canvas and Bullets each lay your tasks out a different way.
How to open Graph View
Open it
Click Graph View in the sidebar, or open a task’s menu and choose Open Graph View to center the graph on that task.
Pick a goal
Use Select a task… to choose the center. The list shows how many subtasks each task has under it.
Explore
Zoom, rotate and re-center on any subtask. Click a task to open it and change it without leaving the graph.
Frequently asked questions
- How do I open Graph View?
- Click Graph View in the sidebar of the PerspecTask app, or choose Open Graph View in a task’s menu to center it on that task.
- What do the colors mean?
- Green tasks are completed, red ones are cancelled, and indigo ones are still open, whatever their open status (active, ready, in progress, waiting or delegated).
- Which task is in the middle?
- The one you pick in Select a task…, or the task you opened it from. With none picked, Graph View centers on the open task with the most subtasks under it.
- How are tasks with several parents shown?
- Under each of their parents, so the graph shows every place a task is needed.
- Are encrypted tasks shown?
- Yes. Until you unlock them with your password they appear as ENCRYPTED, and after that with their real titles. The graph is drawn in your browser.
See where every goal stands
Break a goal into subtasks and Graph View shows you the whole of it, and what is left.